
The Call Center Supervisor can view and export call statistics of calls received by your call center. These statistics can be broken down by queues, dialed numbers, or by individual agents. There are also reports for agent availability and abandoned calls. This tutorial explains how to view them, and what these statistics mean.
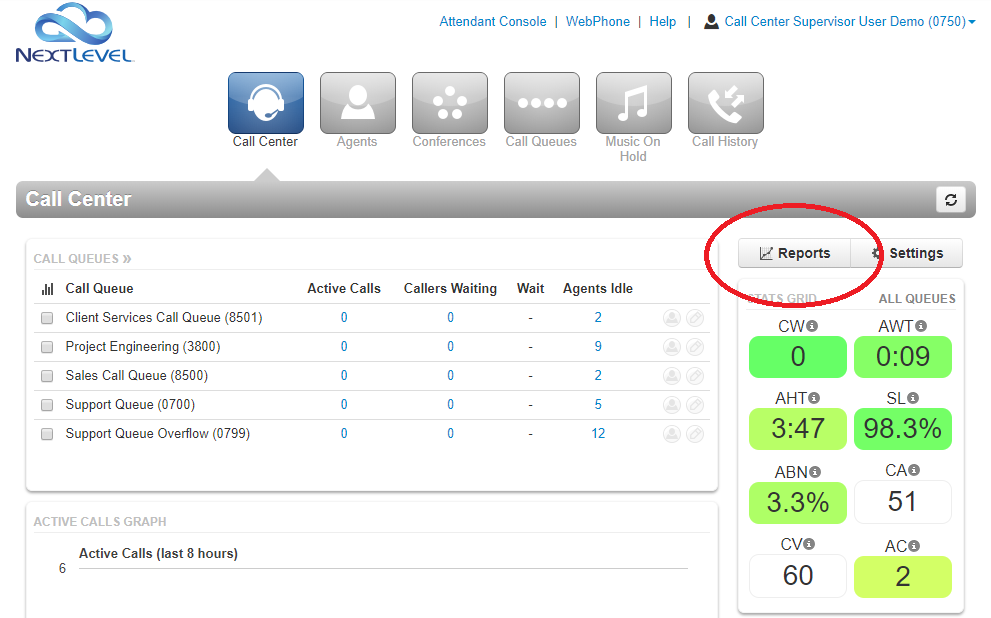
The call center statistics are accessed from the main “Call Center” module. This is the home screen that appears when you first log in. the Call Center Reports window is launched by clicking on the Reports button.
Choose between different reports by selecting from the “Type” dropdown at the top of the window.
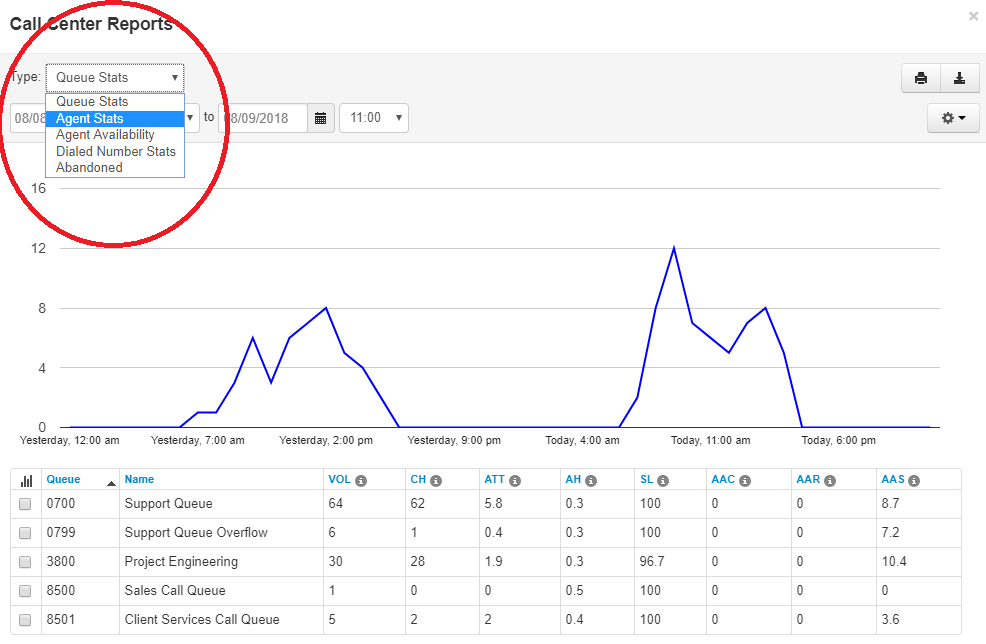
Options available from the control bar include:
- Type – Select the report type
- Dept – Filter report results by department, only calls to selected department will be counted in report (contextual)
- Queue – Filter report results by queue, only calls to selected queue will be counted in report (contextual)
- Time and Date – Select starting date and time and ending date and time to view statistics within that window
- Print – Create a printable report showing the current statistics and graph
- Download – Download a CSV of current statistics
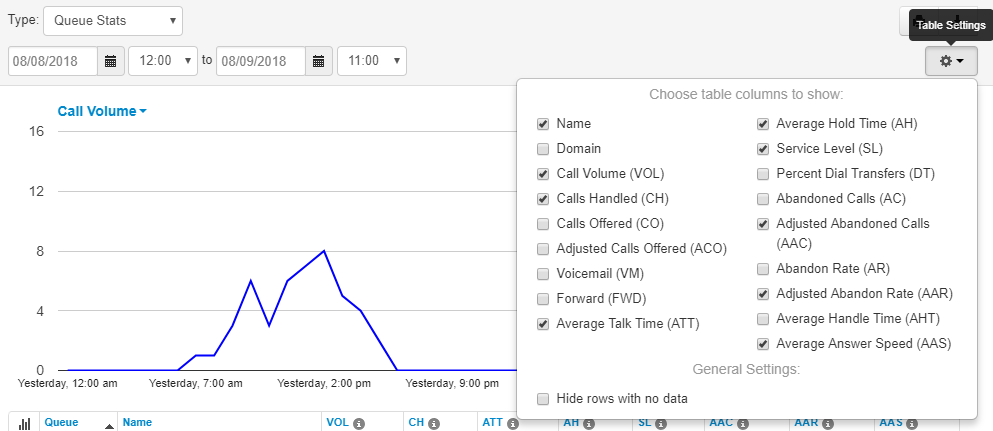
- Settings – Select and deselect which statistics to display in the table

Each report type has a variety of statistics that can be displayed as needed in the table.
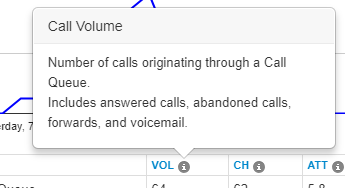
Each statistic (and some other items) include tooltips, which provide a more detailed explanation of what the statistic means.
The Agent Availability report is populated only if the Call Center Agents utilize Call Queue Sign-in and Sign-out and/or reason codes.
Statistic Details
Call Queue Statistics
Call Queue and Dialed Number reports utilize the same set of statistics. The difference between the reports is that the Call Queue type tracks statistics based on which Queue the call is routed through, while the Dialed Number type tracks based on which phone number the call is routed through.
| Stats | Definition |
|---|---|
| Volume (VOL) | Number of calls originating through a Call Queue. Includes answered calls, abandoned calls, forwards, and voicemail. |
| Calls Handled (CH) | Number of calls answered by agent originating through a Call Queue. |
| Calls Offered (CO) | Number of calls that reached the queue to be dispatched to agents. Includes abandoned calls. Excludes forwards and voicemail. |
| Adjusted Calls Offered (ACO) | Adjusted number of calls that reached the queue. Excludes calls abandoned in less than 10 seconds. = (Calls Offered CO) – (Adjusted Abandoned Calls AAC) |
| Voicemail (VM) | Number of calls handled by the voicemail system. |
| Forward (FWD) | Number of calls forwarded to another queue or off-net phone number for handling. Includes forwarded calls to voicemail. |
| Average Talk Time (ATT) | Average number of minutes spent by agent talking per call, on calls originating through a Call Queue. Excludes hold time. |
| Assisted Calls Handled (AST) | Number of calls answered and then forwarded to another agent. |
| Average ACW Time (ACW) | Average time an agent spends between the end of a call and submitting call disposition. |
| Callbacks (CB) | Number of calls that requested a callback rather than waiting in the queue. |
| Average Hold Time (AH) | Average time a caller spends on hold with an agent. Excludes waiting time in the Call Queue. |
| Service Level (SL) | The ratio of calls meeting the configurable service level agreement. |
| Percent Dial Transfers (DT) | Percentage of calls that landed in the queue and were offered to an agent. |
| Abandoned Calls (AC) | Number of calls that abandoned the queue before being answered by an agent. |
| Adjusted Abandoned Calls (AAC) | Adjusted number of calls that abandoned the queue. Excludes calls abandoned in less than 10 seconds. = (Abandoned Calls) – (Number of calls abandoned in less than 10 seconds) |
| Abandon Rate (AR) | Percentage of calls offered that were abandoned before being handled by an agent. = (Abandoned Calls AC) / (Calls Offered CO) |
| Adjusted Abandon Rate (AAR) | Percentage of calls offered that were abandoned, not including those abandoned in under 10 seconds. = (Adjusted Abandoned Calls AAC) / (Adjusted Calls Offered ACO) |
| Average Handle Time (AHT) | Average time an agent spent on a call. Includes Talk Time (TT), Hold Time (AH), and Disposition Time (ACW). |
| Average Wait Time (AWS) | Average number of seconds a caller spent in the selected queue before being dispatched to an agent. If none selected, total for all queues will be displayed. |
Agent Statistics
Statistics are also available by each individual agent in your call center. This allows you to evaluate agents by performance and can help optimize the efficiency of your call center by determining where your agents are best suited.
| Stats | Definition | Type |
|---|---|---|
| Calls Handled (CH) | The number of calls answered by the agent originating through a Call Queue. | Queue Stat |
| Talk Time (TT) | The total number of minutes spent by an agent on answered calls originating through a Call Queue. | Queue Stat |
| Average Talk Time (ATT) | Average number of minutes, per call, spent by the agent talking on calls originating through a Call Queue. Excludes hold time. | Queue Stat |
| Assisted Calls Handled (AST) | Number of calls answered and then forwarded to another agent. | Queue Stat |
| Average ACW Time (ACW) | Average time an agent spends between the end of a call and submitting call disposition. | Queue Stat |
| Average Hold Time (AH) | Average time a caller spends on hold with an agent. Excludes waiting time in the Call Queue. | Queue Stat |
| Average Handle Time (AHT) | Average time an agent spent on a call. Includes Talk Time (TT), Hold Time (AH), and Disposition Time (ACW). | Queue Stat |
| Missed Calls (MC) | Number of calls originating through a call queue offered to an agent but not answered. This includes multiple attempts if a call loops through all agents, but excludes unanswered simultaneous ring calls. | Personal Stat |
| Outbound Attempts (OATT) | Number of outbound call attempts by an agent. Excludes on-net calls and conference calls. | Personal Stat |
| Outbound Answered (OANS) | Number of outbound calls by agent answered by a remote party. Includes calls answered by voicemail. Excludes on-net calls and conference calls. | Personal Stat |
| Outbound Minutes (OM) | Number of minutes spent by an agent on outbound calls. Includes talk and hold time. Excludes call center calls, on-net calls, and conference calls. | Personal Stat |
| Outbound Average (OAvg) | Average length of time spent by an agent on outbound calls. Excludes call center calls, on-net calls, and conference calls. | Personal Stat |
| Inbound Attempt (IA) | Number of attempted calls inbound to agent. Includes call center calls. Excludes on-net calls and conference calls. | Personal Stat |
| Inbound Answered (IANS) | Number of inbound answered calls to an agent. Includes call center calls. Excludes on-net calls and conference calls. | Personal Stat |
| Inbound Minutes (IM) | Number of minutes spent by an agent on inbound calls. Includes call center calls. Includes talk and hold time. Excludes on-net calls and conference calls. | Personal Stat |
| Inbound Average (IAVG) | Average length of time spent by an agent on inbound calls. Includes call center calls. Excludes on-net calls and conference calls. | Personal Stat |
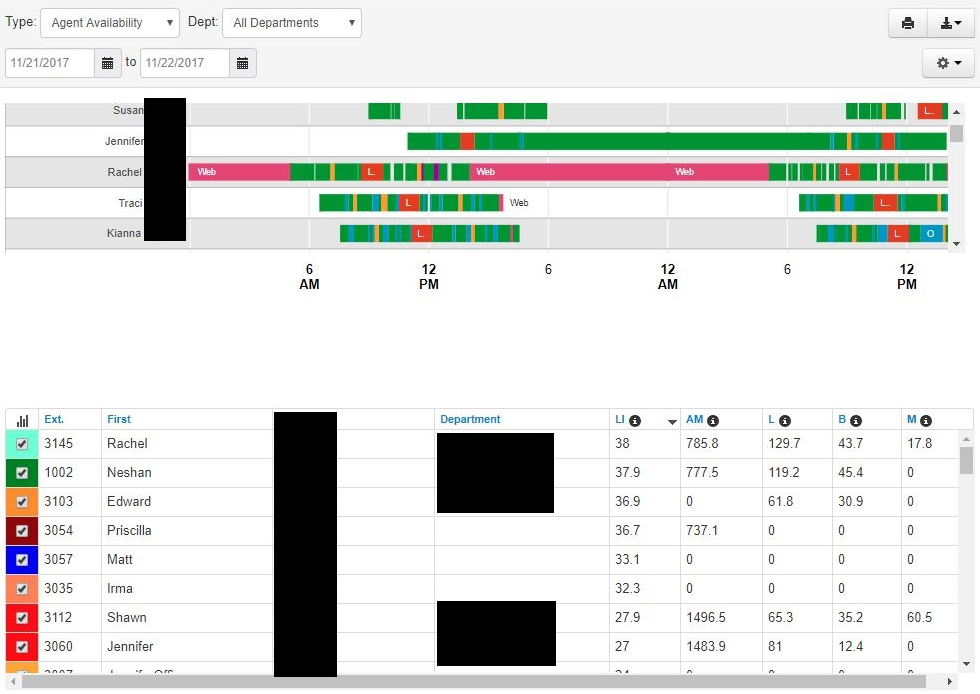
Agent Availability statistics
The Agent Availability report displays an agent’s availability in a domain or in a department within a domain. It will display the time an agent’s status was set to online or set to lunch, etc during the selected time period. Agents must utilize the Call Center Log In and Log Out commands for this report to be utilized properly.
| Stats | Definition |
|---|---|
| Logged In (LI) | This is the total time the call center agent’s status was set to “online”. Agent must manually change their status from offline to online when they begin their shift; simply logging into the portal no longer affects the LI stat. |
| Available (AM) | This is the total time the call center agent was available for calls. This includes time logged in / online. It excludes statuses of unavailable such as break, lunch, meeting, web, and other. |
| Unavailable (UM) | This is the total time the call center agent was not available for calls. Includes time logged off and offline statuses such as break, lunch, meeting, web, and other. Excludes online / available. |
| Lunch (L) | This is the total time the call center agent’s status was set to “lunch”. |
| Break (B) | This is the total time the call center agent’s status was set to “break”. |
| Meeting (M) | This is the total time the call center agent’s status was set to “meeting”. |
| Other (O) | This is the total time the call center agent’s status is not set to available, break, lunch, meeting, or web. Excludes unavailable status. |
| Web (W) | This is the total time the call center agent’s status was set to “web”. |
Call Center Home Screen
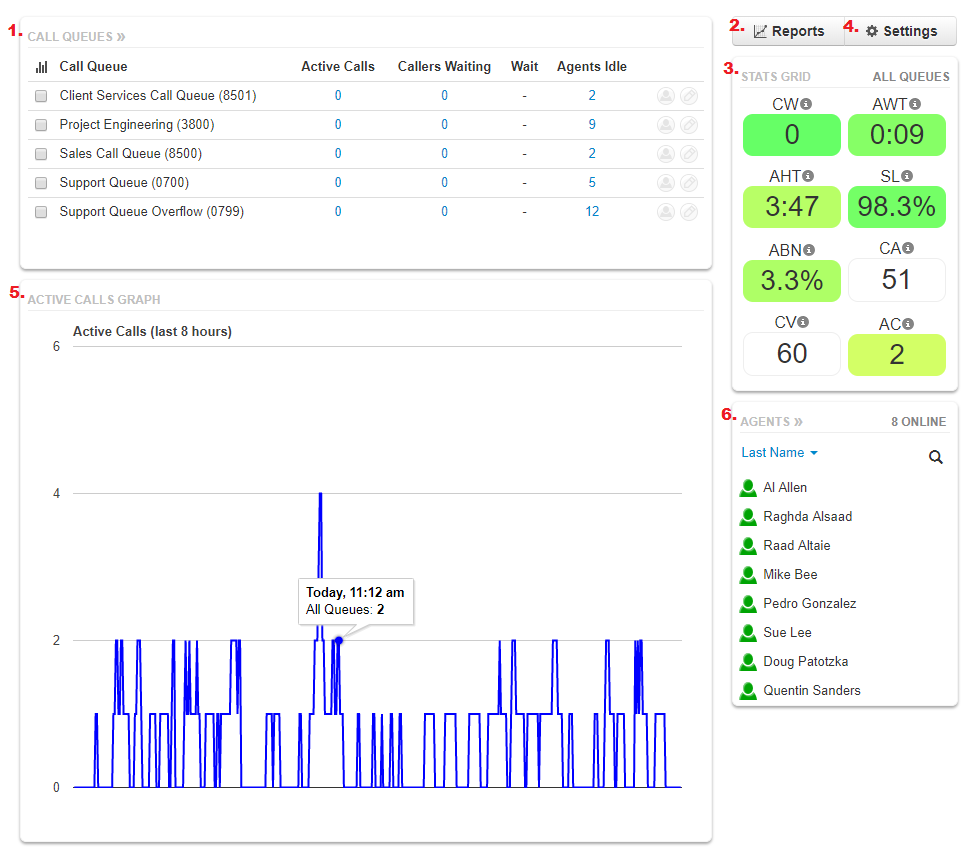
The Call Center Home Screen provides an overview of call center activity. The Call Center panels include:
- Call Queues – A summary of all of the queues assigned to the Call Center Supervisor (see Call Center Supervisor Settings)
- Active Calls – Calls answered by an agent and in currently in progress. Click for details including agent ID, Caller ID information, and duration.
- Callers Waiting – Calls in the queue waiting to be answered. Click for details including Caller ID information and duration. Calls are arranged in the order in which they will be distributed.
- Wait – The current average wait time of callers in the queue
- Agents Idle – The current number of agents in the queue who are available to receive calls. Click to view which agents are available and unavailable, and their disposition (green = available, red = unavailable, grey = offline).
- Edit Agents button (see Manage a Call Queue)
- Edit Queue button (see Manage a Call Queue)
- Reports – View Call Center Reports window
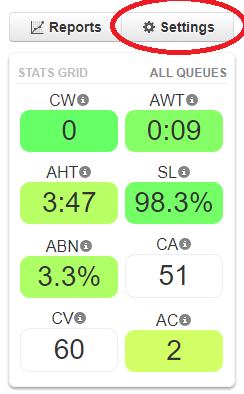
- Stats Grid – View aggregate Call Statistic data for all queues (or selected queues)
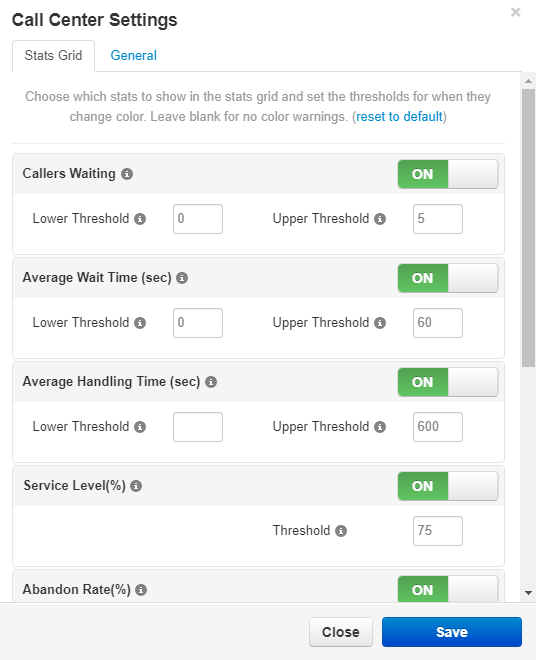
- Stats Grid Settings – Adjust which statistics appear in the Stats Grid, and set thresholds to control the Heat color coding
- Active Calls – The aggregate maximum number of concurrent active calls. Hover over the line for details on time and call quantity.
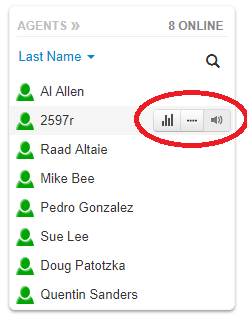
- Agents – View status of all Call Center Agents assigned to the Supervisor’s queues or departments. Hover to view Agent details.
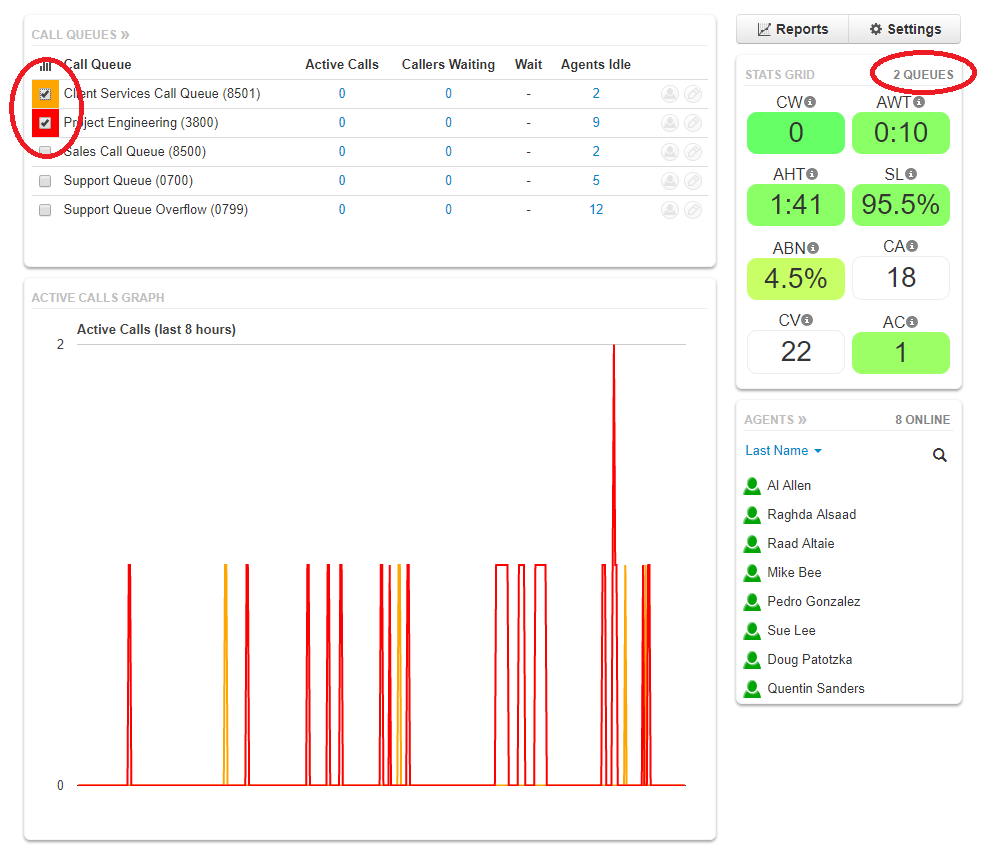
Selecting Call Queues via checkbox will update Stats Grid and Active Calls Graph with information specific to those queues.
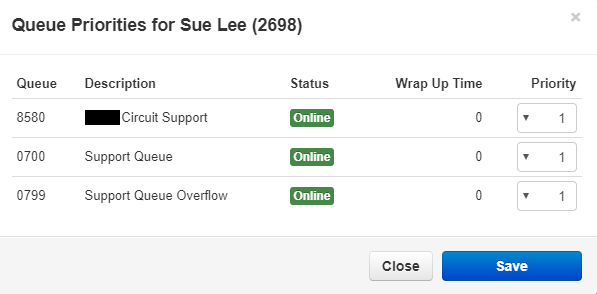
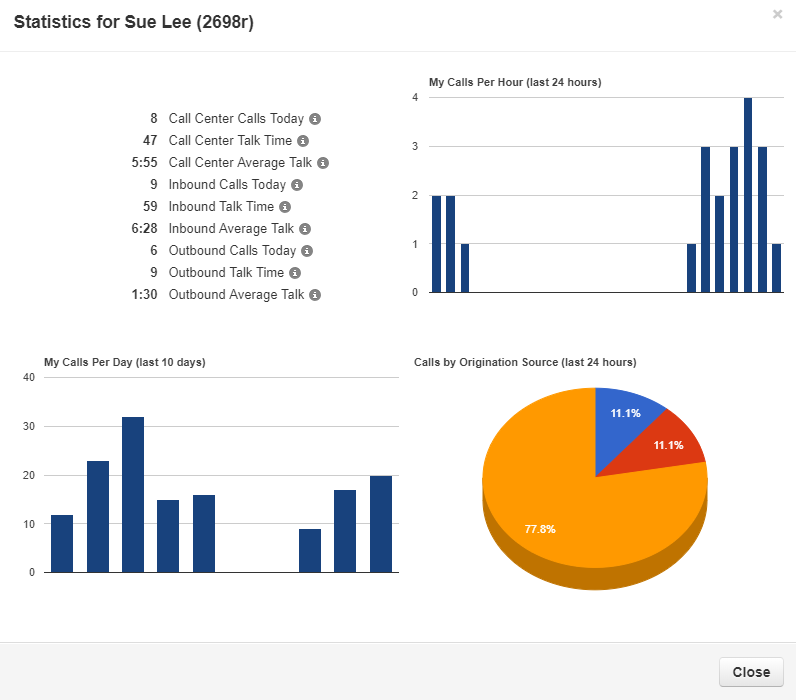
Hover over Agent to view individual performance stats, queue status and priority, and to monitor (Listen/Whisper/Barge) if enabled
Click Settings to toggle which statistics are visible on the stats grid and to set thresholds.
Call Center Supervisor Settings
An Office Manager level user can modify Call Center Supervisor Settings to toggle which Queues and Departments the Supervisor can manage, as well as modifying rights to view and edit Call Queues and Agent membership. Navigate to the “Call Center” tab on the user page of the Supervisor to manage.

Need more help with this?
Don’t hesitate to contact us here.